Exit Rate: Understanding Why Visitors Leave Your Site
Every visitor who leaves your site had a reason. Maybe they found what they needed. Maybe they got frustrated. Maybe they never intended to buy in the first place. The challenge isn’t stopping people from leaving — it’s understanding why they leave and whether that signals a problem you can fix.
Exit rate is the metric that reveals where visitors end their journey on your site. Unlike bounce rate, which only captures single-page visits, exit rate shows you the last page people see before they go — regardless of how many pages they viewed first. This distinction matters enormously for understanding your site’s actual performance.
This guide explains how to analyze exit patterns, what they reveal about user experience, and how to use exit intent signals to improve conversions without invasive tracking.
Exit Rate vs Bounce Rate: The Critical Distinction
These two metrics are constantly confused, but they measure fundamentally different things. Getting this wrong leads to misguided optimization efforts.
| Metric | What It Measures | Scope | Best Used For |
|---|---|---|---|
| Bounce Rate | Single-page sessions | Entry pages only | Landing page effectiveness |
| Exit Rate | Where sessions end | All pages | Funnel drop-off analysis |
Here’s the key insight: all bounces are exits, but not all exits are bounces. A bounce happens when someone lands on a page and leaves without visiting any other page. An exit happens when someone leaves from any page, regardless of how many pages they viewed before.
Consider this example: A visitor lands on your homepage, browses three product pages, reaches checkout, then leaves. That’s not a bounce — they engaged with multiple pages. But it is an exit from the checkout page. And that exit might indicate a serious conversion problem.
How Modern Analytics Calculate These Metrics
In modern event-based analytics, bounce rate has evolved. A “bounce” is now typically defined as a session that:
- Lasts less than 10 seconds
- Has no conversion events
- Includes only one pageview
This is actually more useful than the old definition, which counted any single-page session as a bounce — even if someone spent 20 minutes reading an article. The new approach focuses on engagement rather than raw pageviews.
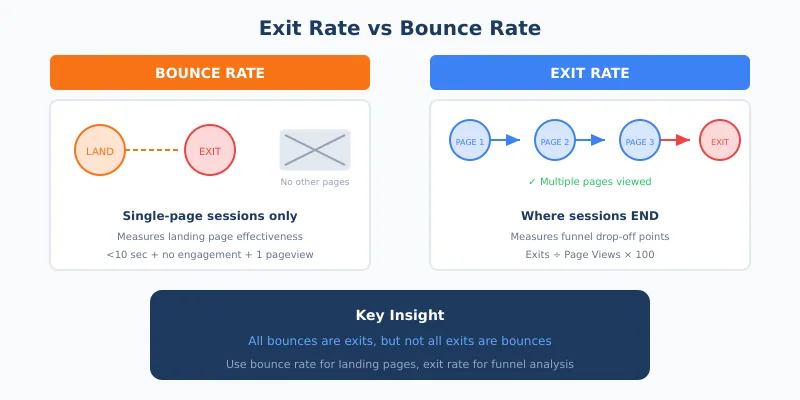
Exit rate remains straightforward: exits from a page divided by total views of that page, expressed as a percentage. If your pricing page gets 5,000 views and 1,500 of those are the last page before visitors leave, your exit rate is 30%.
What Exit Rates Actually Tell You
A high exit rate isn’t automatically bad. Context determines whether it’s a problem or perfectly expected behavior.
When High Exit Rates Are Normal
Some pages are natural endpoints:
- Thank you / confirmation pages — Visitors completed their goal; leaving is expected
- Blog posts — Readers often consume one article and go; 70-80% exit rates are common
- Contact pages — After finding your phone number or address, people leave
- Documentation / help articles — Users found their answer and don’t need more
In these cases, high exit rates may actually indicate success. The visitor accomplished what they came for.
When High Exit Rates Signal Problems
Certain pages should keep visitors moving forward. High exit rates here indicate friction:
- Checkout pages — Why are people abandoning before completing purchase?
- Pricing pages — Are visitors experiencing sticker shock? Confusion?
- Product pages — Is the information insufficient to make a decision?
- Category / listing pages — Can visitors find what they’re looking for?
- Sign-up forms — Is the form too long, unclear, or asking for too much?
For these funnel pages, aim for exit rates in the 20-40% range. Significantly higher suggests something is blocking conversions.
Exit Rate Benchmarks by Page Type
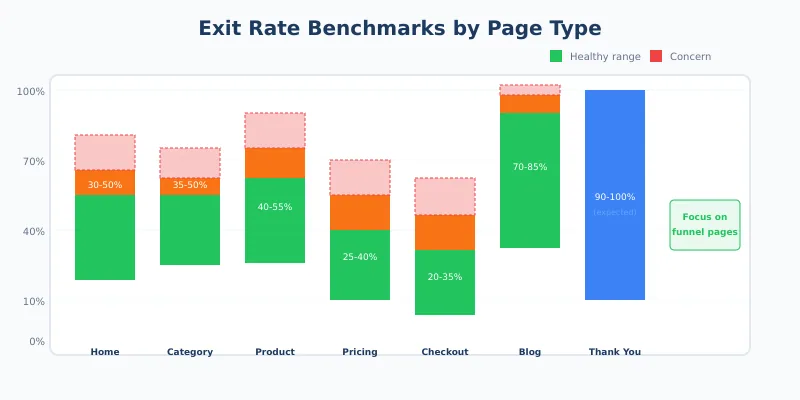
Benchmarks help calibrate your expectations, but remember that every site is different. Use these as starting points, not absolute standards.
| Page Type | Typical Exit Rate | Concern Threshold |
|---|---|---|
| Homepage | 30-50% | >60% |
| Category / listing pages | 35-50% | >55% |
| Product pages | 40-55% | >65% |
| Pricing page | 25-40% | >50% |
| Cart page | 40-60% | >70% |
| Checkout | 20-35% | >45% |
| Blog posts | 70-85% | >90% |
| Thank you pages | 90-100% | N/A — expected |
When your rates exceed these thresholds consistently, that’s a signal to investigate further. But a single high-exit page isn’t necessarily a crisis — look for patterns across similar pages.
Finding Your Problem Pages
Most analytics platforms let you sort pages by exit rate. Start by identifying pages with both high exit rates and high traffic volume. A page with 95% exit rate but only 50 monthly views isn’t your priority. A page with 55% exit rate and 10,000 views deserves immediate attention.
The Exit Rate Analysis Process
- Pull your top exit pages — Sort by total exits, not just exit rate
- Calculate the impact — Exit rate × page views = total exits
- Categorize by page type — Compare against appropriate benchmarks
- Identify outliers — Which pages are significantly above their category average?
- Prioritize by impact — Focus on high-traffic pages where improvements matter most
In my experience, this analysis often reveals surprising insights. Pages you assumed were performing well may have hidden exit problems. Pages you never considered may be silently killing conversions.
Common Reasons Visitors Leave (And How to Identify Them)
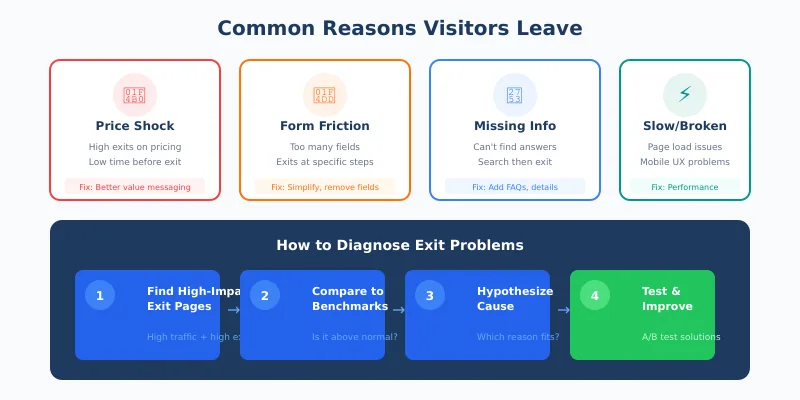
High exit rates have root causes. Understanding these patterns helps you diagnose issues without invasive user tracking.
Price or Value Mismatch
If your pricing page has abnormally high exits, visitors may be experiencing sticker shock or failing to understand your value proposition. Signs include:
- High exits immediately after viewing pricing
- Low time-on-page before exit
- Exits concentrated on specific price tiers
The fix isn’t necessarily lowering prices. Often it’s better communicating value, offering payment options, or providing comparison context.
Friction in Forms
Forms are exit magnets. Every field you add increases abandonment. Watch for:
- High exits on pages with forms
- Longer forms having higher exit rates than shorter ones
- Exits concentrated at specific form steps in multi-step processes
Analyze which fields correlate with exits. Required phone numbers, complex passwords, and unclear error messages are common culprits.
Missing Information
When visitors can’t find answers to their questions, they leave. Look for:
- High exits on product pages despite good traffic
- Search queries that lead to exits (visitors searched, didn’t find, left)
- Exits after visiting multiple similar pages (suggesting comparison shopping that didn’t resolve)
The solution often involves adding FAQs, improving product descriptions, or making comparison information more accessible.
Technical Problems
Slow pages drive exits. Broken functionality kills conversions. Check for:
- Exit rate correlations with page load time
- Higher exits on mobile vs desktop (often indicating mobile UX issues)
- Exits concentrated at interactive elements (buttons, forms, filters)
Performance matters enormously. For more on this connection, see our article on website speed and its impact on metrics.
Navigation Confusion
If visitors can’t figure out where to go next, they leave. Indicators include:
- High exits from pages that should lead somewhere (category pages, search results)
- Unusual navigation patterns before exit (visiting the same pages repeatedly)
- Exits from pages with clear next steps that aren’t being taken
Test your navigation with fresh eyes. What seems obvious to you may confuse new visitors.
Understanding Exit Intent Signals
Exit intent refers to behavioral signals that indicate a visitor is about to leave. These patterns can be detected in real-time, enabling last-moment interventions or simply better understanding of user behavior.
Common Exit Intent Signals
- Mouse movement toward browser controls — Cursor moving toward the close button or address bar
- Rapid scroll to top — Often precedes clicking the back button
- Tab switching — User attention shifting away from your site
- Prolonged inactivity — User has stopped engaging but hasn’t left yet
- Back button positioning — On mobile, specific gestures indicate intent to navigate away
These signals can trigger various responses, from exit surveys to special offers. But use them carefully — aggressive exit popups annoy users and can damage trust.
Privacy-Respecting Exit Analysis
You don’t need invasive tracking to understand exits. Aggregate data tells the story:
- Page-level exit rates — Where do people leave? No personal data needed.
- Session flow analysis — What paths lead to exits? Aggregate patterns, not individual journeys.
- Time-on-page before exit — Quick exits vs considered exits tell different stories.
- Entry-to-exit correlations — Which traffic sources have highest exit rates?
This approach aligns with first-party data strategies — you’re analyzing your own site behavior without tracking individuals across the web.
Using Exit Data to Improve Conversions
Data without action is just storage. Here’s how to translate exit rate insights into improvements.
Prioritize by Business Impact
Not all exits are equal. A 10% reduction in checkout exits directly increases revenue. A 10% reduction in blog post exits… might not matter much.
Calculate the potential impact:
- Identify your highest-impact exit pages (funnel pages with high traffic)
- Estimate the value of a completed journey (purchase value, lead value, etc.)
- Calculate: Potential recovered conversions = Current exits × Realistic improvement rate
- Multiply by value to estimate revenue impact
This prioritization ensures you focus on exits that actually affect business outcomes.
Test Hypotheses Systematically
Don’t guess why people leave — test your theories:
- If you suspect price concerns — Test adding value messaging, payment plans, or money-back guarantees
- If you suspect form friction — Test shorter forms, progress indicators, or different field orders
- If you suspect missing information — Test adding FAQs, reviews, or comparison tables
- If you suspect technical issues — Test performance improvements on high-exit pages
A/B testing connects changes to results. Without testing, you’re making changes based on assumptions that may be wrong.
Consider Exit Surveys (Carefully)
Exit intent surveys can provide qualitative data that analytics can’t capture. When a visitor shows exit intent, a brief survey can ask why they’re leaving.
Best practices for exit surveys:
- Keep it extremely short — One question maximum at exit moment
- Offer multiple choice — People won’t type detailed responses when leaving
- Make it easy to dismiss — Respect the user’s decision to leave
- Don’t ask everyone — Sample a percentage to avoid survey fatigue
- Target specific pages — Exit surveys on checkout are more valuable than on blog posts
Response rates for well-designed exit surveys range from 5% to 30%. Even at the lower end, that’s meaningful qualitative data about why visitors leave.
Exit Rate in the Customer Journey Context
Individual page exit rates tell part of the story. The full picture emerges when you analyze exits within customer journeys.
Mapping Exit Points to Journey Stages
Consider where in the funnel exits occur:
| Journey Stage | Exit Indicates | Typical Response |
|---|---|---|
| Awareness (blog, content) | Content didn’t convert to interest | Improve CTAs, related content suggestions |
| Consideration (product, pricing) | Didn’t see enough value or fit | Better information, social proof, comparisons |
| Decision (cart, checkout) | Friction or second thoughts | Simplify process, address objections |
| Post-purchase (account, support) | Task completed or frustration | Distinguish between success and failure exits |
This framework helps you understand not just where exits happen, but what they mean in context.
Comparing Exit Patterns Across Segments
Different visitor segments may have dramatically different exit patterns:
- New vs returning visitors — New visitors often exit earlier in the funnel
- Mobile vs desktop — Mobile exits may indicate UX problems
- Traffic source — Paid traffic may have different expectations than organic
- Geographic — International visitors may exit due to shipping or language concerns
Segment analysis often reveals that “high exit rate” problems are actually specific to certain audiences, allowing more targeted solutions.
Connecting Exits to Other Metrics
Exit rate doesn’t exist in isolation. Analyze it alongside complementary metrics for fuller understanding.
- Exit rate + Time on page — Quick exits suggest immediate problems; slow exits suggest consideration then rejection
- Exit rate + Scroll depth — Do people exit before seeing key content?
- Exit rate + Previous page — What journey led to this exit?
- Exit rate + Conversion rate — High exit rate but decent conversion may be acceptable
For more on meaningful metrics beyond simple pageviews, see advanced metrics that predict business success.
Continue Learning
Explore more about understanding visitor behavior and improving conversions:
- CTA Buttons: How to Track Their Performance — Understand what actions visitors take before exiting
- Tracking Unique Visitors — Distinguish between new and returning visitor exit patterns
- The Hidden Cost of Spam Traffic — Bot traffic can artificially inflate exit rates
Bottom Line
Exit rate reveals where your site loses visitors — and often, where you lose conversions. Unlike bounce rate, which only captures first impressions, exit rate shows you the full journey and exactly where it ends.
Not all exits are problems. Thank you pages should have 100% exit rates. Blog posts naturally have high exits. But when funnel pages — pricing, checkout, signup forms — show exit rates above benchmarks, that’s a signal to investigate.
The goal isn’t to prevent all exits. People will leave eventually. The goal is understanding whether they leave satisfied (found what they needed) or frustrated (couldn’t complete their goal). Exit rate, combined with contextual analysis, helps you tell the difference.
Start by identifying your highest-impact exit pages — high traffic funnel pages with above-average exit rates. Hypothesize why visitors leave. Test improvements. Measure results. This systematic approach turns exit data from a vanity metric into actionable intelligence that improves your site’s actual performance.
Every exit tells a story. Your job is to listen.