
Automated traffic isn’t background noise anymore. It’s the signal that corrupts all other signals. In 2024, automated requests exceeded human activity, reaching 51% of all internet traffic. Within that, 37% were bad bots (fraud, scraping, abuse) and 14% were “good” bots (indexers, monitors). That’s not a rounding error — that’s your KPIs being silently taxed.
What spam/bot traffic breaks first
It distorts core KPIs.
- Sessions / Users / Pageviews. Inflated denominators reduce CR and make “awareness” look cheap.
- Engagement. Near-zero dwell, robotic scroll signatures, flat click entropy.
- Attribution. Bad bots cluster in “cheap” channels → budget shifts the wrong way.
- A/B tests. Power drops. Confidence intervals widen. You ship worse variants.
Table — Metric vs. Distortion vs. Decision Risk
| Metric | Distortion pattern | Decision risk |
|---|---|---|
| Conversion Rate (CR) | Denominator grows from non-humans | Overestimation of funnel issues on UX, underestimation of media fraud |
| ROAS/CAC | “Low-cost” traffic looks efficient | Budget reallocation into fraudulent placements |
| Retention/Cohorts | Bot sessions pollute cohorts | False negatives on product value, wrong lifecycle triggers |
| Attribution (MTA/MMM) | Extra noise in referrers, UTM spoof | Channel mix bias; vendor selection errors |
Define the enemy precisely
Standards matter. Use the MRC IVT taxonomy:
- GIVT — easy filters (known data centers, declared crawlers, etc.).
- SIVT — hard cases: hijacked devices, residential proxies, domain spoofing, invalid app IDs. Requires multi-signal corroboration.
Reality check: public telemetry shows persistent bot volume globally (Cloudflare Radar), with “verified bots” only a slice of the total; the rest are unidentified or malicious automation. Track both.
How to detect bot traffic — field signals (no magic)
Server/CDN/WAF layer
- Burstiness: >60 req/min/IP on HTML endpoints; flat inter-arrival times.
- ASN/Hosting: High share from cloud ASNs. Prioritize review, don’t blanket-block.
- TLS/JA3 + UA: Mismatched fingerprints, headless hints, tool UAs (curl, python-requests).
- Method mix: HTML without static asset fetches; 4xx/5xx spikes.
Client-side telemetry
- No real input events. Keyboard/mouse entropy ≈ 0.
- Identical fingerprints. Same viewport/locale/TZ combos repeating.
- Sub-second “reads”. Page open → immediate close → repeat.
Sources & campaigns
- Referrer spam. Unknown hosts with zero click trails.
- UTM anomalies. Campaign IDs with no spend, or spend with zero human engagement.
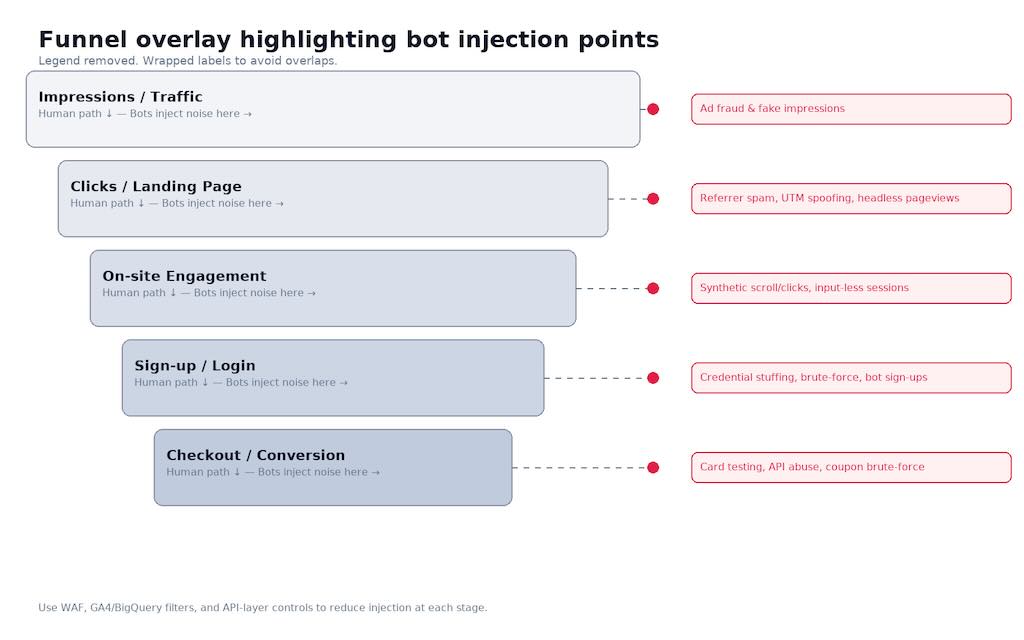
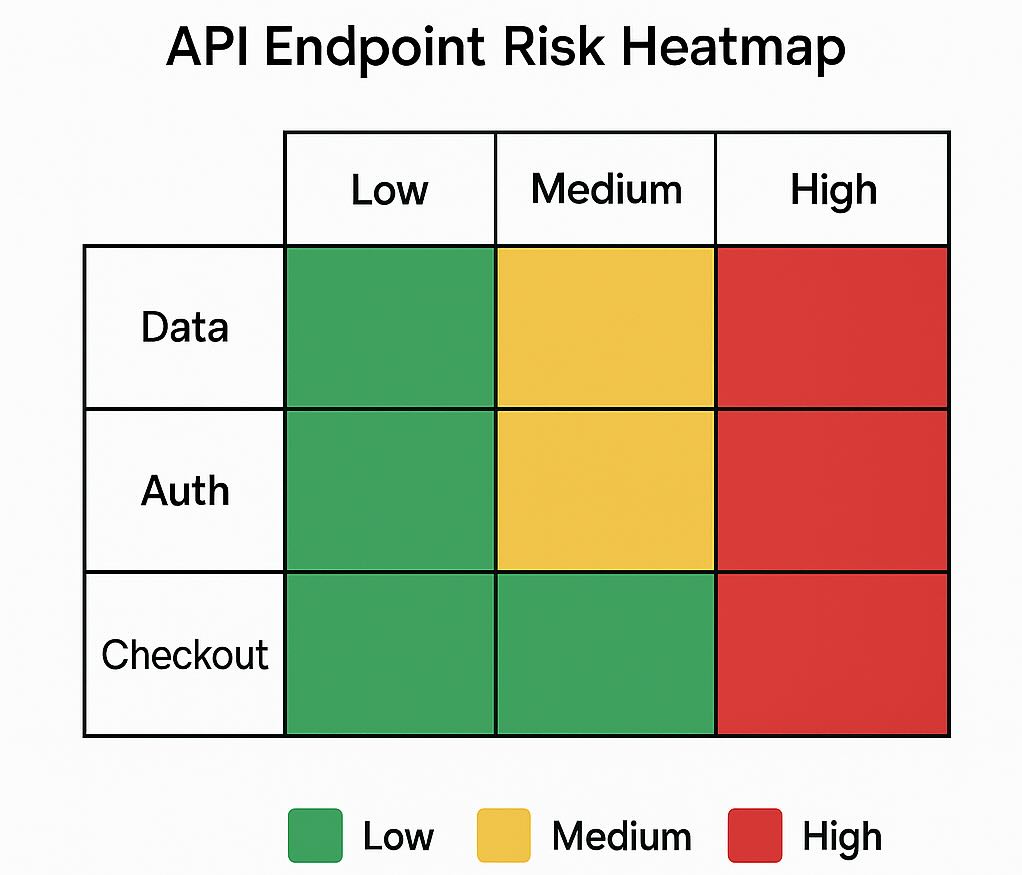
Why care now? Because attackers moved to APIs. In 2024, 44% of advanced bot traffic targeted APIs. Travel, retail, and financial services led the charts. Your marketing and product endpoints are targets.
Place for screenshot: WAF rate graph with spikes; GA4 segment config panel.
How to identify bot traffic in GA4 (and similar) — practical cuts
Fast GA4 segment (UI logic)
engagement_time_msec < 3000event_count <= 1OR noscroll/clickevents- Device consistency checks: same model/locale across geos
- Source check: referrers not resolvable; utm_source seen only in invalid traffic
BigQuery SQL (GA4 export) — frequency & entropy flags
-- Suspicion score per user_pseudo_id per day
WITH hits AS (
  SELECT
    user_pseudo_id,
    DATE(TIMESTAMP_MICROS(event_timestamp)) AS d,
    COUNTIF(event_name IN ('first_visit','session_start')) AS sessions,
    COUNT(*) AS events,
    APPROX_TOP_COUNT(user_agent, 1)[OFFSET(0)].value AS ua_top,
    COUNT(DISTINCT event_name) AS event_kinds,
    COUNT(DISTINCT geo.country) AS country_variety,
    COUNT(DISTINCT device.category) AS device_variety
  FROM `project.dataset.events_*`
  WHERE _TABLE_SUFFIX BETWEEN '20250101' AND '20251231'
  GROUP BY 1,2
)
SELECT
  user_pseudo_id, d,
  events,
  sessions,
  event_kinds,
  country_variety,
  device_variety,
  -- Heuristics: tune thresholds per site
  (events > 200) + (sessions > 20) +
  (event_kinds < 2) + (country_variety > 1) + (device_variety > 1) AS suspicion_score
FROM hits
HAVING suspicion_score >= 3
ORDER BY d, events DESC;
What this catches. High-rate actors, low semantic diversity, geo/device hopping. Tune thresholds on your baseline.
Detect bot traffic with the edge — WAF rules that work
Cloudflare Expression — challenge noisy data centers, spare allow-lists
(http.request.uri.path contains "/login" or http.request.uri.path contains "/checkout")
and not cf.client.bot
and ip.geoip.asnum in { "16276", "16509", "13335", "15169" }  /* OVH, AWS, Cloudflare, Google: sample */
and (cf.threat_score > 10 or cf.bot_management.score < 30)
Action: Managed Challenge. Maintain an allow-list for partners, QA, monitoring. Rotate.
Nginx rate-limit for HTML only (don’t starve assets):
map $http_accept $is_html {
  default 0;
  "~*text/html" 1;
}

limit_req_zone $binary_remote_addr zone=html:reqs:10m rate=30r/m;

server {
  location / {
    if ($is_html) {
      limit_req zone=html burst=30 nodelay;
    }
    try_files $uri $uri/ /index.html;
  }
}
Honeypot link (invisible to humans):
<a href="/__trap" rel="nofollow" tabindex="-1" aria-hidden="true"
   style="position:absolute;left:-9999px;top:-9999px;">.</a>
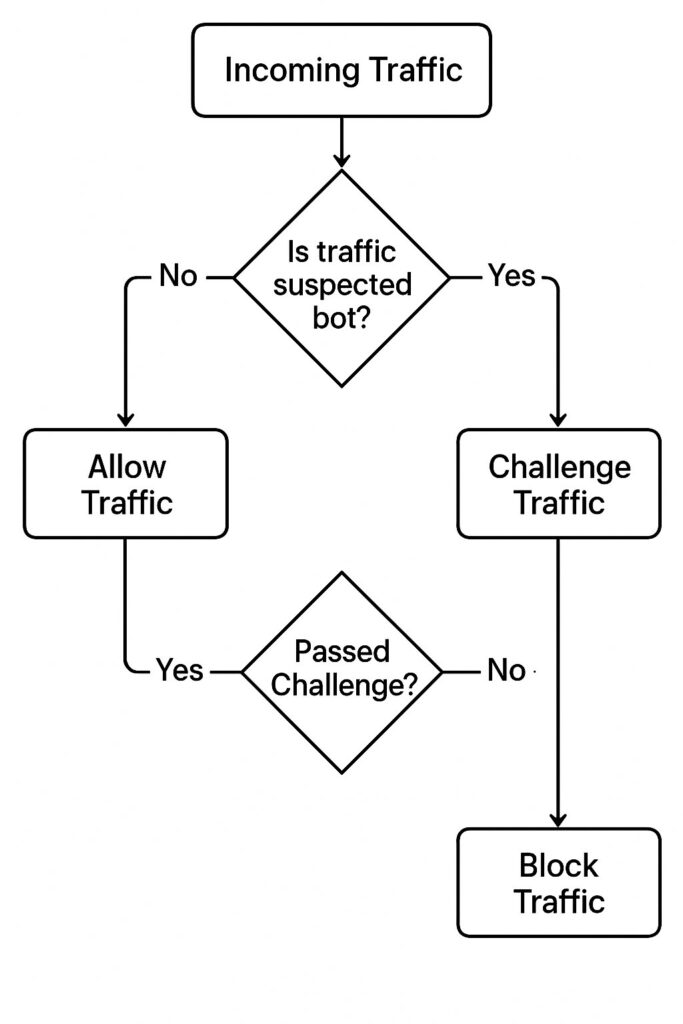
How to stop bot traffic without wrecking UX
- Progressive friction. Score → challenge high-risk → block only on conviction.
- Rate limiting where it hurts bots. HTML, login, cart, search; not static assets.
- API protection. Per-endpoint quotas, token binding, server-side checks on Measurement Protocol to stop event injection.
- Campaign hygiene. Signed click IDs, strict UTM governance, auto-blacklist referrers with zero human engagement.
Context: global data shows bots are a material slice of traffic (Akamai SOTI: ~42% bots, ~65% malicious), and independent bot-management telemetry confirms persistent, advanced automation against APIs (F5). Build controls assuming constant pressure.
Quantify the “invisible tax”
Table — Indicators, thresholds, actions (start conservative, iterate)
| Indicator | Suggested threshold | Action |
|---|---|---|
| Engagement time | < 2–3s median per session | Flag; exclude from CR/ROAS; add JS challenge |
| Events per minute per IP (HTML) | > 60 | Rate-limit; log; raise WAF score |
| Share from DC ASNs (sessions) | > 20% | Deep-dive by source; temporary challenge |
| Honeypot hit rate (per 1k sessions) | > 5 | Tighten rules; block IP/ASN clusters |
| API auth failures | Spike vs. baseline | Throttle; credential stuffing detection |
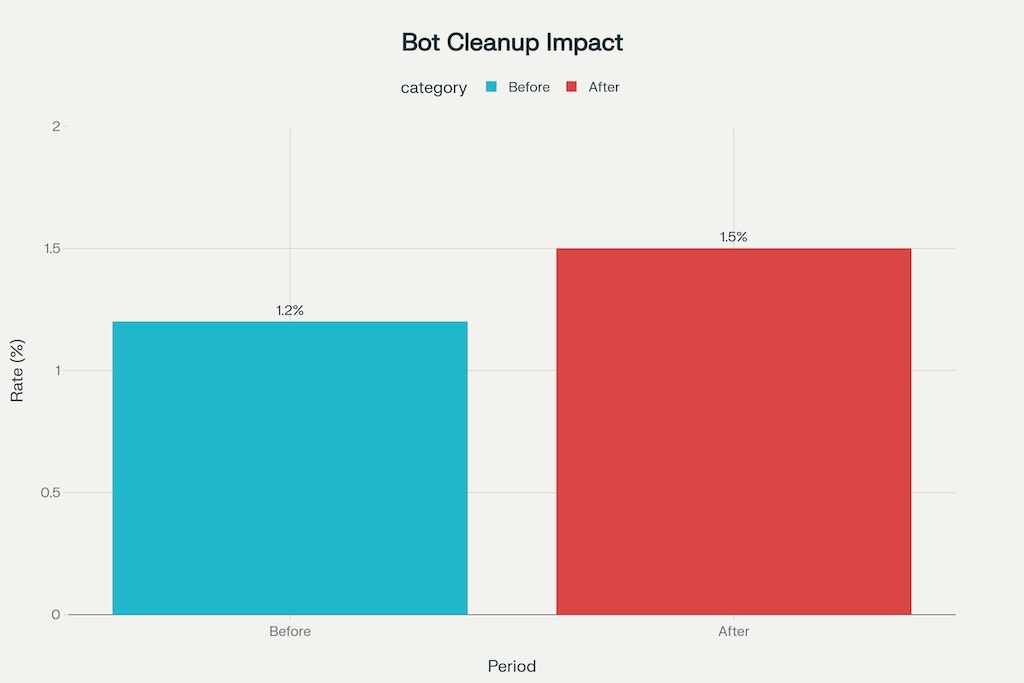
Before/After cleanup (template)
| Metric | Before | After | Δ | Notes |
|---|---|---|---|---|
| Sessions | 100% | 82% | −18% | Removed SIVT+GIVT segments |
| CR | 1.2% | 1.5% | +0.3 pp | Denominator corrected |
| ROAS | 280% | 220% | Realistic | Budget shift expected |
| A/B detectable effect | 3.0 pp | 3.8 pp | More power | Less variance |
Detect bot traffic in paid media (sanity checks that catch fraud fast)
- Clicks vs. engaged sessions. Ratio explodes → click-injection or bots.
- By-hour distribution. Nighttime spikes in your top geos.
- Creative/placement entropy. Many placements, zero unique behaviors.
- Post-click behavior. No scroll; no subsequent events; repeated model/locale.
Independent investigations repeatedly show verification blind spots and inconsistent filtering across vendors; don’t outsource judgement. Cross-verify logs, analytics, and ad platform data before asking for make-goods. The Wall Street Journal
Data pipeline: keep a clean reporting layer
- Parallel “clean” dataset. Apply filters in SQL/WAF first, then report. Never overwrite raw.
- Feature store for scoring. Request rate, UA/TLS hash, input entropy, honeypot hits, ASN.
- Auditability. Versioned rules; diff every rule change; monitor FPR/FNR.
Place for screenshot: BigQuery scheduled query with exclusion logic.
Appendix for practitioners (short, tactical)
Bot fingerprint features to log
- JA3/TLS hash, UA string, accept-lang, IP ASN, verified-bot header, inter-arrival times, input event counts, viewport entropy, WebGL hash.
Campaign controls
- Signed click macros, referrer allow-lists, canonical UTM dictionary, auto-quarantine for new referrers pending review.
API-first checklist
- Token binding to client; per-user and per-IP quotas; idempotency keys; anomaly alerts on endpoint-specific KPIs.
Continue Learning
Explore more about data quality and accurate measurement:
- Why Tracking Unique Visitors Matters — understand true audience size beyond bot noise
- Beyond Pageviews: Advanced Metrics — focus on metrics that matter for business
- AI in Privacy-First Analytics — use ML for anomaly detection and data quality