Customer Lifetime Value: How to Calculate It Without Fooling Yourself

Ask three founders how they calculate customer lifetime value and you will get three different numbers for the same business. That is not sloppiness on their part. The formula itself comes in several competing versions, and the textbooks disagree about which one to teach.
Lifetime value still deserves a place in your reporting, because it answers a question no traffic chart can: how much is a customer worth once you subtract what it costs to serve them? But the number carries assumptions, and small teams tend to inherit those assumptions without noticing.
So let us work through what the metric measures, which formula fits your situation, and the conditions under which the whole exercise gives you a confident answer that happens to be wrong.
What Lifetime Value Measures
Lifetime value estimates the total contribution one customer makes across their entire relationship with you. Contribution, not revenue — the distinction matters, because a customer who spends $500 while costing you $400 in fulfilment and support is not a $500 customer.
The working definition in our glossary reduces to three inputs: what a customer pays per period, what share of that you keep after variable costs, and how long they stay. Everything else in the calculation is a refinement of those three.
The third input causes most of the trouble. Nobody knows how long a customer will stay, so the number gets inferred from your churn rate — and that inference is where the competing formulas part ways.
Three Formulas, Three Different Answers
In 2012 Peter Fader of Wharton and Bruce Hardie of London Business School published a short note comparing how lifetime value gets taught. They found that standard marketing textbooks hand students three different formulas for the same inputs, depending on which reading the course assigned.
Their verdict was blunt. A large number of colleagues teaching the subject were “unaware of the existence of these competing formulas and therefore do not call attention to the interesting and important factors that underlie these differences.”
The formulas diverge on two questions, and neither is a matter of arithmetic:
- Does the customer’s first payment count? If you already have the money from the initial purchase, including it inflates the forward-looking estimate you use to judge acquisition spend.
- When does each period’s cash land? Booking it at the start of a period rather than the end changes how heavily the discount rate bites.
Both choices are defensible. Neither is wrong. But they produce materially different numbers, so two teams can run the same customer data and disagree by a wide margin while both believing they followed the standard method.
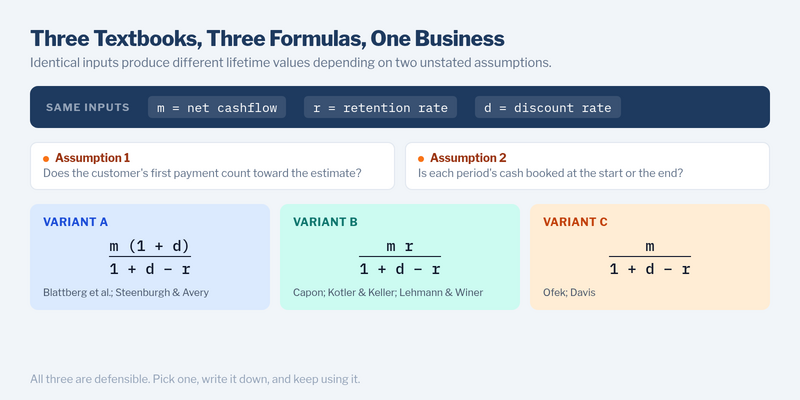
The practical response is not to hunt for the one true equation. It is to write down which assumptions you picked, then keep picking the same ones. A lifetime value figure is only comparable to another figure built the same way.
Picking a Method That Matches Your Business
Before reaching for a formula, decide how much history you actually have. The three approaches below ask for very different amounts of data, and the cheapest one is often enough.
| Approach | What it needs | Best when | Main weakness |
|---|---|---|---|
| Historical Add up what past customers actually spent | 12+ months of order or subscription records | You have a settled product and want a defensible baseline | Describes the past; says nothing about customers you acquire differently |
| Simple predictive Average revenue × margin × expected lifespan | Churn rate, margin, average revenue per customer | You need a quick figure to sanity-check marketing spend | Assumes every customer behaves like the average — they do not |
| Cohort-based Track each intake month separately as it ages | Orders grouped by signup month, ideally 6+ months deep | Your product or pricing has changed, or growth is uneven | Takes longer to read; early cohorts stay incomplete |
Most small teams should start with the cohort view, even though it looks like more work. A single blended number hides the thing you most need to see, which is whether customers acquired this quarter behave like the ones from last year. Cohort analysis keeps that comparison visible instead of averaging it away.
The 3:1 Rule Was a Guess
Somewhere in your reading you have met the rule that lifetime value should be at least three times what it costs to acquire a customer. It appears in pitch decks and board packs as though a research team derived it from a large sample.
It did not come from a study. The ratio was popularised by investor David Skok, who framed it as a rough guideline drawn from the software companies he had spent time inside. His own wording keeps the hedge intact: the guideline for a healthy business is that the number “should be greater than 3.”
Years later Skok returned to the topic with Jared Sleeper of Matrix Partners and added a correction that rarely travels with the ratio itself. He wrote that he had “made a significant mistake in not telling my readers when it would make sense to compute LTV and CAC.”
That correction matters more than the ratio. A benchmark observed in mature subscription businesses with years of retention history says very little about a two-year-old shop with fifty repeat customers. Treat 3:1 as a conversation starter, not a passing grade.
When Your Business Is Too Young for This Number
Skok and Sleeper set a specific condition: the ratio becomes meaningful once you have found a repeatable and scalable growth process. Before that point, both halves of the fraction move for reasons that have nothing to do with customer economics.
You are probably too early if any of these describe you:
- Your oldest customers signed up less than one full churn cycle ago, so nobody has had the chance to leave yet
- Half your customers arrived through a single referral or one lucky mention, which you cannot repeat on demand
- Pricing changed in the last two quarters, so old cohorts and new ones are not measuring the same product
- Your monthly customer count is small enough that two cancellations swing the churn rate by several points
None of that means you should ignore retention. It means you watch the raw counts — how many customers came back this month, how many did not — instead of compressing them into a single figure that implies more certainty than you have.
Working It Out Without Tracking Individuals
Lifetime value has a reputation as a metric that demands invasive tracking, because the textbook version follows named individuals across every visit. In practice you rarely need that, and the version you do need lives in systems you already run.
The inputs come from your billing or order records, not from your website analytics. Those records already exist as a lawful part of running the business, and they are grouped by account rather than by browsing behaviour.
A workable setup for a small team looks like this:
- Group orders by the month the customer first bought. Your order export almost certainly has both dates already.
- Sum revenue per cohort per month of age, so month three of the January intake sits beside month three of the April intake.
- Subtract variable costs — payment fees, fulfilment, support time — to get contribution rather than turnover.
- Compare acquisition spend against the same cohorts, using channel totals rather than person-level attribution.
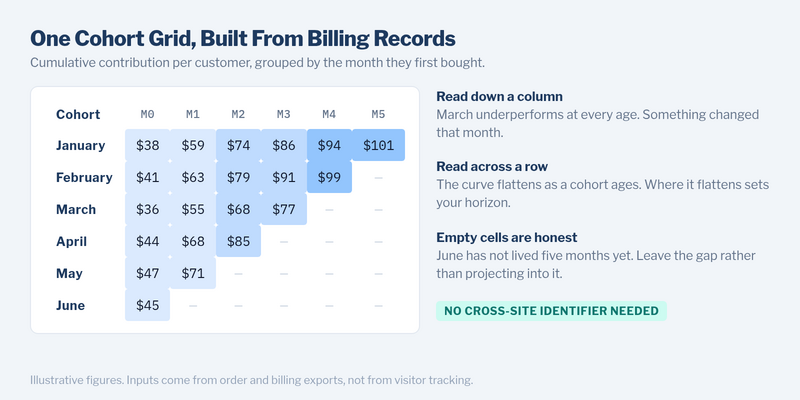
Nothing there requires a cross-site identifier or a consent-heavy profile. The customer relationship is contractual, so the data is first-party by construction — the same principle behind a wider first-party data strategy.
Where the Number Goes Wrong
Four failure modes account for most of the bad lifetime value numbers I have been shown. They are easy to spot once you know the shape of them.
- One average retention rate for everybody. Fader and Hardie make this point repeatedly in their work on customer-base analysis: aggregate figures “mask considerable heterogeneity in individual-level retention probabilities.” Cohort retention tends to look like it improves with age, but the customers did not become more loyal — the restless ones already left, so the survivors skew the average.
- Revenue standing in for contribution. Dropping margin from the calculation is the fastest way to double your lifetime value on paper. It is also the most common shortcut, because revenue is the easier figure to export.
- A lifespan longer than the company. Projecting a five-year customer relationship out of eight months of records produces a confident number resting on nothing. Cap the horizon at roughly the age of your oldest cohort.
- Comparing against acquisition costs that exclude your own time. Founder hours spent on sales calls are a real cost. Leave them out and the ratio flatters a channel that only works while you personally run it.
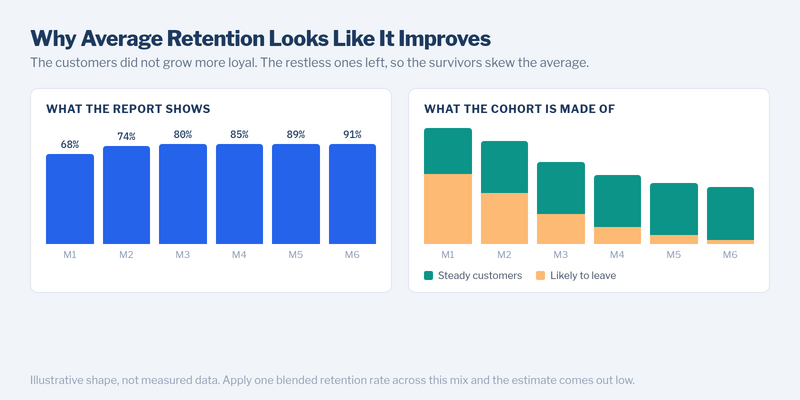
The first one is worth dwelling on, since it quietly biases the result. When a single retention rate gets applied to a mixed customer base, the estimate of what your existing customers are still worth comes out low. Teams then underinvest in keeping the customers who were never going anywhere.
Continue Learning
- The Three Revenue Metrics Every Small Team Should Track Weekly — the short-cycle figures that tell you whether the lifetime value estimate is drifting
- Cohort Analysis — how to group customers by intake period so retention stays readable
- Churn Rate — the input that decides most of your lifespan assumption
Putting the Number to Work
Lifetime value earns its place when it changes a decision. If the figure would not alter what you spend, who you chase, or what you fix, then calculating it more precisely is a way of looking busy.
So pick the cohort method, write your two assumptions down where the rest of the team can see them, and recalculate on a fixed schedule rather than whenever someone asks. A number you can reproduce next quarter beats a more elegant one you cannot.
Then check it against the thing it is supposed to guide. If your acquisition spend and your lifetime value have been moving in the same direction for two quarters, the model is doing its job. If they have not, the assumptions need revisiting before the formula does.