Web Analytics Segmentation: Break the Average to See the Truth

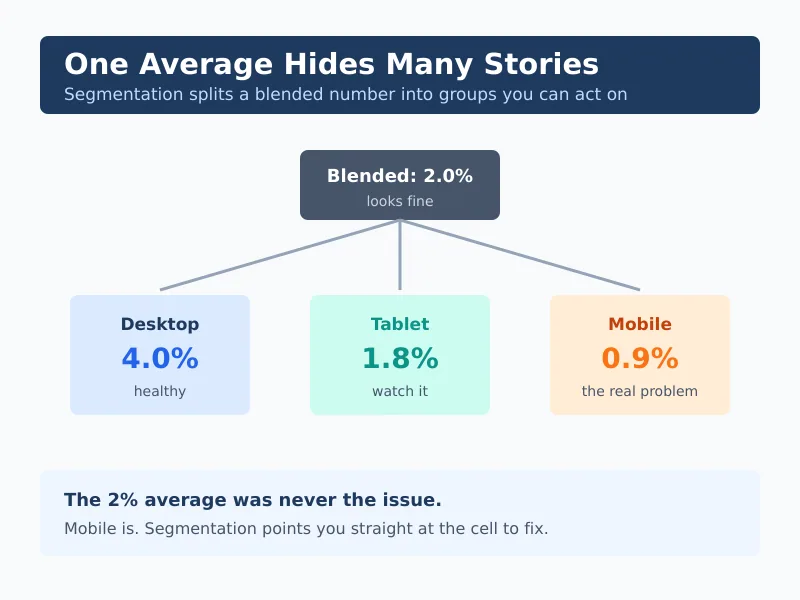
An average is a lie that everyone agrees to believe. “Our conversion rate is 2%” feels like a fact, but it hides the truth that mobile converts at 0.8% while desktop converts at 4%. Web analytics segmentation is how you break that comforting average apart and see what’s really happening. It’s the single fastest way to turn a flat report into an actual decision.
In my experience, most small teams already have the data they need to segment — they just never split it. They stare at one blended number and wonder why their “fix” never moved it. This guide explains what segmentation is, which segments matter most, and how to use them without collecting a shred of personal data.
What Is Web Analytics Segmentation?
Web analytics segmentation means splitting your audience into meaningful groups so you can compare how each one behaves. Instead of one conversion rate, you get a rate per device, per channel, per landing page, or per visitor type. The comparison is where the insight lives.
Think of it like a doctor reading blood work. The overall “you’re fine” tells you almost nothing. The breakdown — this marker high, that one low — tells you exactly where to look. Segmentation does the same thing for your website.
Related: tracking unique visitors sets up the people-vs-pageviews distinction that good segments depend on.
The Segments That Actually Matter
You can slice data a hundred ways, but a handful of segments do most of the work for a small business. Start here before inventing anything custom.
| Segment | What it reveals | Why it matters |
|---|---|---|
| Device (mobile / desktop) | Where the experience breaks | Mobile gaps quietly drain revenue |
| Traffic channel | Which sources bring buyers | Tells you where to invest effort |
| New vs returning | Acquisition vs loyalty health | Two very different problems |
| Landing page | Which entry points convert | Pinpoints pages to fix or scale |
| Geography | Where demand concentrates | Guides localisation and timing |
Notice none of these require knowing who a person is. Device type, channel, and entry page are all properties of the visit, not the visitor. That’s exactly why segmentation fits a privacy-first approach — you get sharp insight from aggregate behaviour, without profiles or identifiers.
Device Is Usually the First Win
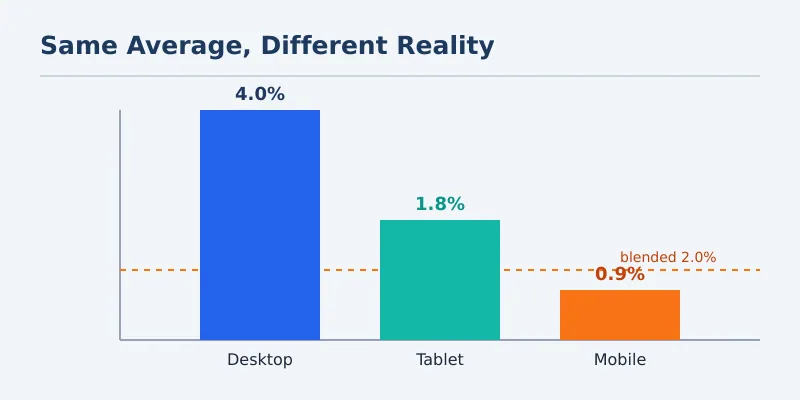
If you only run one segment this month, run device. Mobile and desktop visitors behave differently, and a layout that feels fine on your laptop can be a thumb-fumbling mess on a phone. For example, a checkout that converts at 4% on desktop and 0.9% on mobile isn’t a “2% problem” — it’s a mobile emergency hiding behind a blended average.
New vs Returning Tells Two Stories
New visitors test your first impression. Returning visitors test whether you earned a second look. Consequently, a high new-visitor count with weak conversion points to a messaging or trust gap, while strong returning behaviour signals a product worth coming back for. I unpack this split in depth in the new-versus-returning guide linked at the end.
How Segmentation Changes a Decision
Here’s a real-shaped example. A small store sees a 2% conversion rate and decides to “redesign the homepage.” Before spending a week on that, they segment by device and channel. The picture changes completely.
| Segment | Visits | Conversion |
|---|---|---|
| Desktop · email | 1,200 | 5.1% |
| Desktop · organic | 2,800 | 3.2% |
| Mobile · organic | 4,500 | 0.9% |
| Mobile · social | 1,500 | 0.4% |
| Blended | 10,000 | 2.0% |
The homepage was never the problem. The mobile experience was. Therefore the team’s week is better spent fixing mobile checkout than redesigning a desktop layout that already converts. That’s a different decision, a smaller cost, and a bigger payoff — all from one split.
A blended number tells you something happened. A segment tells you where to go fix it.
How to Start Segmenting in 20 Minutes
- Pick one metric that matters — usually conversion rate or engaged time.
- Split it by device first. This alone catches most hidden problems.
- Then split by channel. You’ll often find one source dragging the average down.
- Look for the worst-performing cell with meaningful volume. That’s your target.
- Ignore tiny segments. A 0% rate on 12 visits is noise, not signal.
- Fix one cell, then re-measure. Don’t change five things at once.
That last point matters more than it sounds. If you change five things and the number moves, you’ll never know which change worked. Segment, isolate, fix one cell, confirm. Then move to the next.
Common Segmentation Mistakes
- Over-segmenting. Slice too thin and every cell becomes statistical noise.
- Chasing tiny samples. Wait for enough volume before trusting a rate.
- Segmenting without a question. Decide what you’re trying to learn first.
- Comparing segments of wildly different sizes as if the percentages are equally reliable.
- Building identity-based segments. You don’t need to know who — only how the group behaved.
The last one is both an ethics point and a practical one. Behavioural segments — device, channel, entry page — give you almost all the insight with none of the privacy risk. The GDPR principle of data minimisation and the UK ICO’s guidance both point the same direction: collect less, learn more.
Continue Learning
Explore more about reading your audience clearly:
- Understanding Traffic Sources — the channel segment, explained in full.
- Beyond Pageviews: Advanced Metrics — what to measure once you’ve split it.
- Exit Rate: Why Visitors Leave — a metric that gets sharper once segmented.
Bottom Line
Web analytics segmentation is the cheapest upgrade you can make to your reporting. Split your blended averages by device, channel, and visitor type, and the real story appears almost immediately. Start with device, fix one cell at a time, and skip anything that requires knowing who your visitors personally are.
The average was never the answer. The breakdown is.