Understanding Traffic Sources: Where Your Visitors Really Come From
Most small teams look at one number — total visits — and call it analytics. That single number hides the most useful question you can ask about your traffic: where did these people actually come from? Understanding traffic sources is the difference between guessing why a good week happened and being able to repeat it. It’s also the cheapest analysis you’ll ever run, because the data is already sitting in your reports.
In my experience, the teams that grow steadily aren’t the ones with the fanciest dashboards. They’re the ones who know which channels bring buyers, which bring tire-kickers, and which quietly waste budget. This guide breaks down the main traffic sources, how to read each one honestly, and how to act on what you find — without naming a single tool or invading anyone’s privacy.
What “Traffic Source” Actually Means
A traffic source is simply the origin of a visit — the path a person took to land on your page. Analytics groups these origins into a handful of channels so you can compare them. The grouping matters more than the raw count, because a hundred visits from one channel can be worth ten times a hundred visits from another.
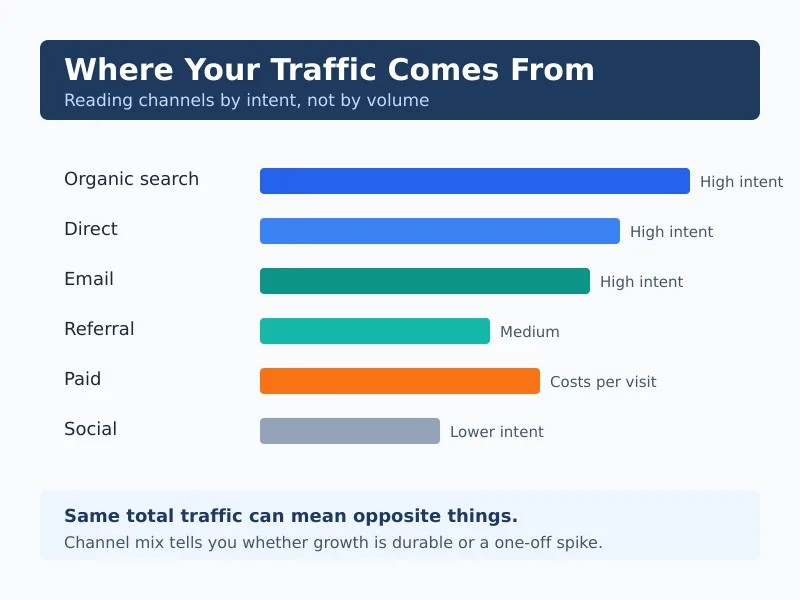
Most platforms recognize a consistent set of channels. Here’s the standard breakdown, plus what each one tells you about intent.
| Channel | Where it comes from | Typical intent |
|---|---|---|
| Organic search | Unpaid search-engine results | High — they searched for a need |
| Direct | Typed URL, bookmark, untagged link | High — they already know you |
| Referral | A link on another website | Medium — borrowed trust |
| Social | Posts and profiles on social platforms | Low to medium — often browsing |
| Links inside your newsletters | High — an existing audience | |
| Paid | Ads you paid to place | Varies — depends on targeting |
Notice that intent, not volume, drives the value column. A founder who only watches total traffic misses this entirely. By contrast, a founder who reads the channel mix knows whether last month’s spike came from buyers or from a viral post that converted nobody. The Nielsen Norman Group makes the same point: data is only useful once it’s tied to a question worth answering.
Related: Beyond Pageviews: Advanced Metrics That Predict Business Success shows why channel mix beats raw visit counts.
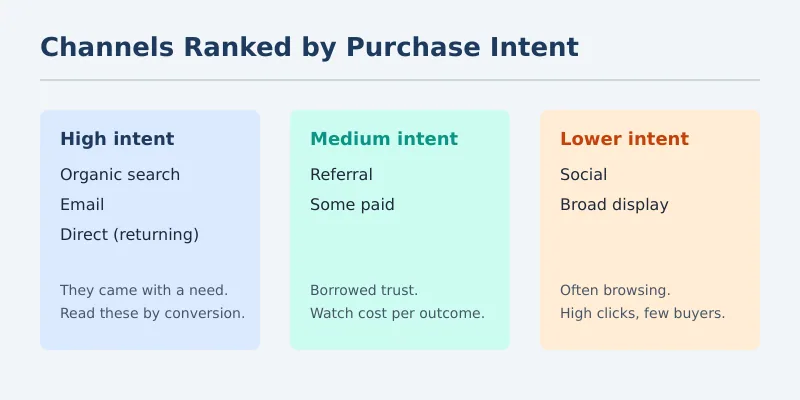
The Six Channels, Read Honestly
Each channel has a story it tells and a trap it hides. Here’s how to read each one without fooling yourself.
Organic Search
Organic visitors typed a need into a search box and chose your result. That intent makes them valuable. However, organic traffic is slow to build and slow to lose, so don’t expect this week’s blog post to move the number. The trap: branded searches (people searching your company name) get bucketed with organic, inflating it. Strong brand awareness can make organic look healthier than your content actually is.
Direct
Direct traffic is loyalty made visible — people who typed your URL or used a bookmark. Consequently, a rising direct share is a quiet sign of a returning audience. The trap is that “direct” is also a dumping ground. Untagged email links, app clicks, and links from secure pages all land here when the source can’t be detected. So treat a large unexplained direct number as a tagging problem, not a victory.
Referral and Social
Referral traffic arrives through a link on another site, which means someone else vouched for you. Social works similarly but with weaker intent — people are usually browsing, not buying. For instance, a mention in a respected industry newsletter often converts better than ten times the volume from a casual social share. Read these channels by conversion, not by clicks.
Email and Paid
Email reaches an audience that already opted in, so it usually punches above its weight on conversion. Paid traffic, on the other hand, is the only channel where you can scale volume on demand — but you pay for every visit, so cost per outcome matters far more than the visit count. Ultimately, the question for paid is never “how many?” but “what did each one cost, and what did they do?”
Why Channel Mix Beats Total Volume
Imagine two months with identical traffic — 10,000 visits each. On paper they look the same. In reality, they can mean opposite things for your business.
| Channel | Month A | Month B |
|---|---|---|
| Organic search | 2,000 | 5,500 |
| 500 | 2,000 | |
| Social | 6,500 | 1,000 |
| Paid | 1,000 | 1,500 |
| Total | 10,000 | 10,000 |
Month A leans on a social spike with low intent. Month B leans on search and email — durable, high-intent channels. Therefore Month B is a healthier business, even though the headline number is identical. This is exactly the kind of insight that disappears when you only track totals.
If your reports show one channel doing all the heavy lifting, you have a concentration risk. A single algorithm change or a single ad-account suspension could erase most of your traffic overnight. Diversifying channels is risk management, not vanity.
How to Audit Your Sources in 30 Minutes
You don’t need a data team for this. Follow these steps once a month and you’ll catch most problems early.
- Pull the channel report for the last 90 days. Ignore daily noise; look at the shape.
- Rank channels by conversions, not visits. The order usually surprises people.
- Flag any channel over 60% of total. That’s your concentration risk.
- Check direct traffic for bloat. If it’s unusually high, you have untagged links leaking value.
- Compare cost per outcome on paid against the conversion rate of your free channels.
- Write one sentence describing what changed and why. Future-you will thank present-you.
That untagged-direct problem is fixable. Tagging your campaign and email links cleans up the data so each visit lands in the right channel. I cover the discipline behind that in the campaign-tracking guide linked below.
Common Mistakes to Avoid
- Judging social by volume. High clicks, low buyers is the norm. Measure outcomes.
- Trusting a fat direct number. It usually means broken tagging, not loyalty.
- Ignoring channel concentration. One dominant source is a fragility, not a flex.
- Mixing branded and non-branded search. Separate them, or you’ll overrate your content.
- Comparing paid clicks to free clicks as if they’re equal. One has a price tag.
None of this requires personal data or invasive tracking. Channel attribution works on the aggregate path a visit took, which keeps your analytics both useful and respectful — the whole point of a privacy-first approach. If you operate in the EU, the GDPR principle of data minimisation rewards exactly this kind of aggregate-first measurement, and the UK’s Information Commissioner’s Office publishes practical guidance on staying compliant.
Continue Learning
Explore more about reading your traffic clearly:
- Why Tracking Unique Visitors Matters — separate people from pageviews before you judge a channel.
- Beyond Pageviews: Advanced Metrics — the numbers that predict growth.
- The Hidden Cost of Spam Traffic — why some “traffic” should never count.
Bottom Line
Understanding traffic sources turns a flat visit count into a map of where your growth actually comes from. Read channels by intent and outcome, not by volume. Watch for concentration risk, clean up your tagging, and let the honest channel mix guide where you spend your next hour and your next dollar.
Do that consistently and you stop reacting to traffic. You start steering it.